Part 1 - Final Project
Outline
Stress has become an integral part of modern day life. Through this exercise, I am trying to summarize what it is, what causes it, how many people are experiencing it, and some ways to manage it.
Structure
I am planning on using a three act structure for this. This is analogous to the suggested storytelling structure in Good Charts. This would be followed by a clear call to action for students who are to graduate in near future and join the corporate America.
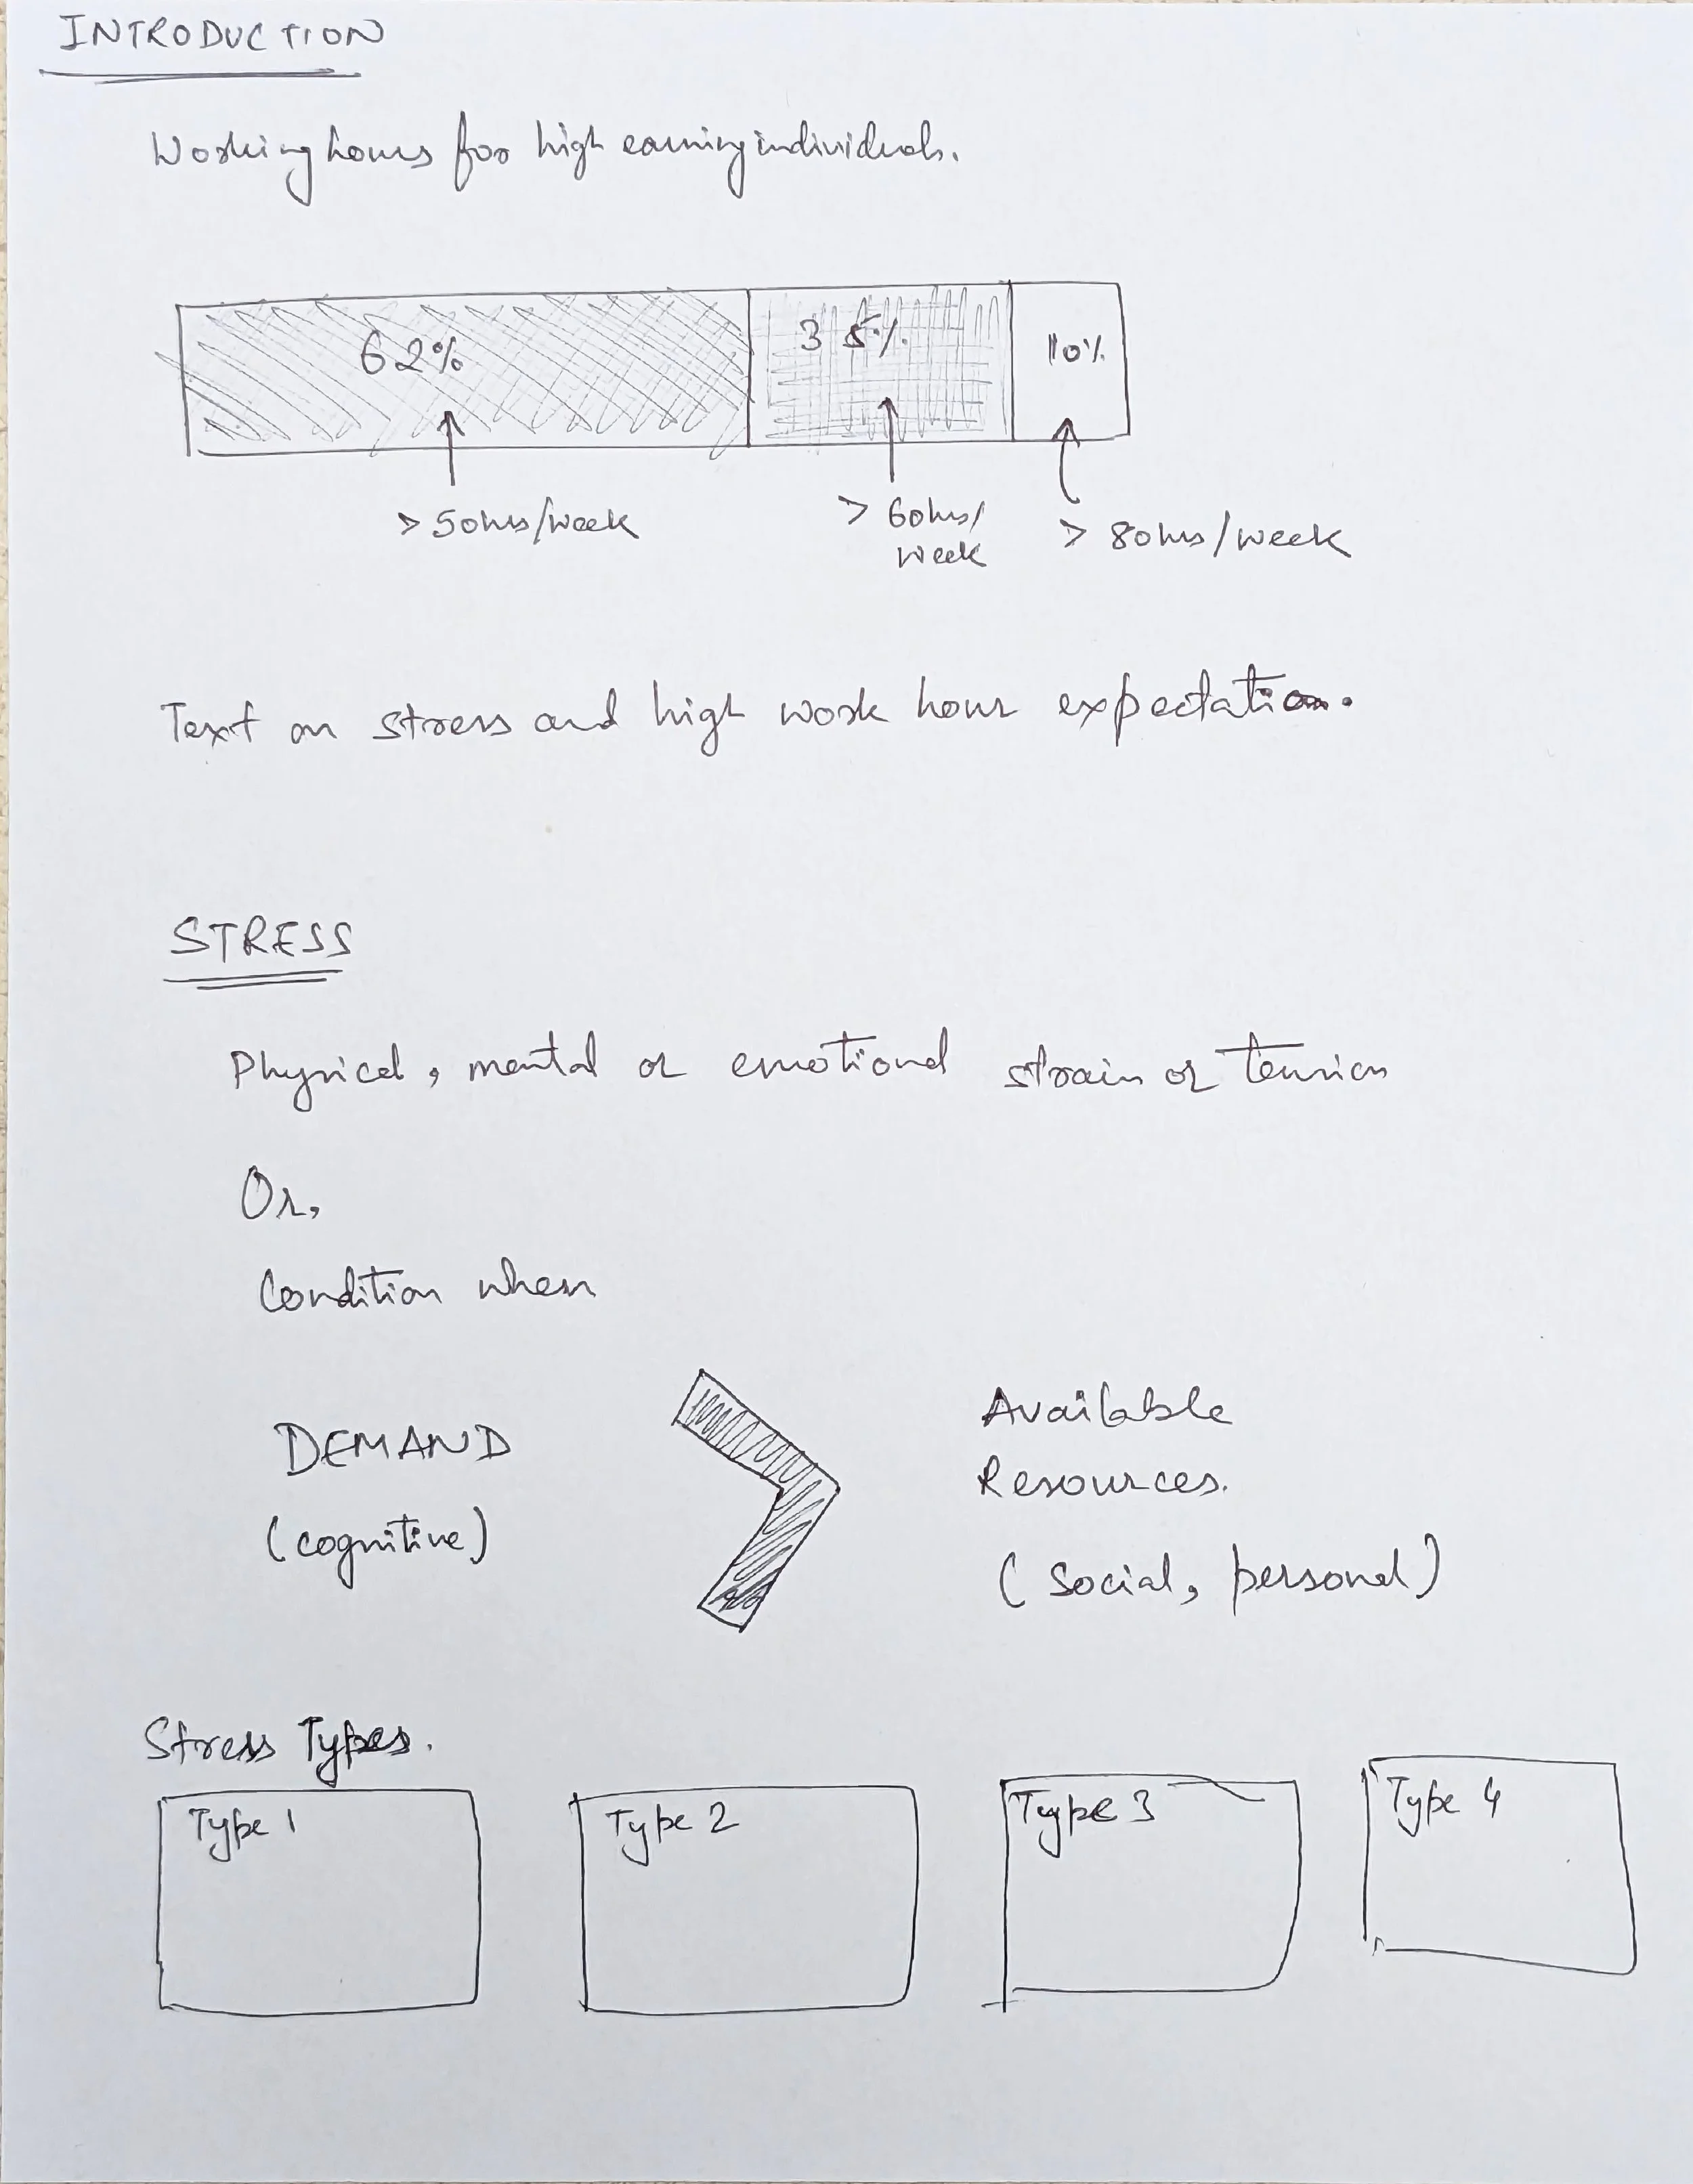
Setup Everything around us has become demanding. High-functioning jobs are the ones most sought out for both because of the impact & compensation.
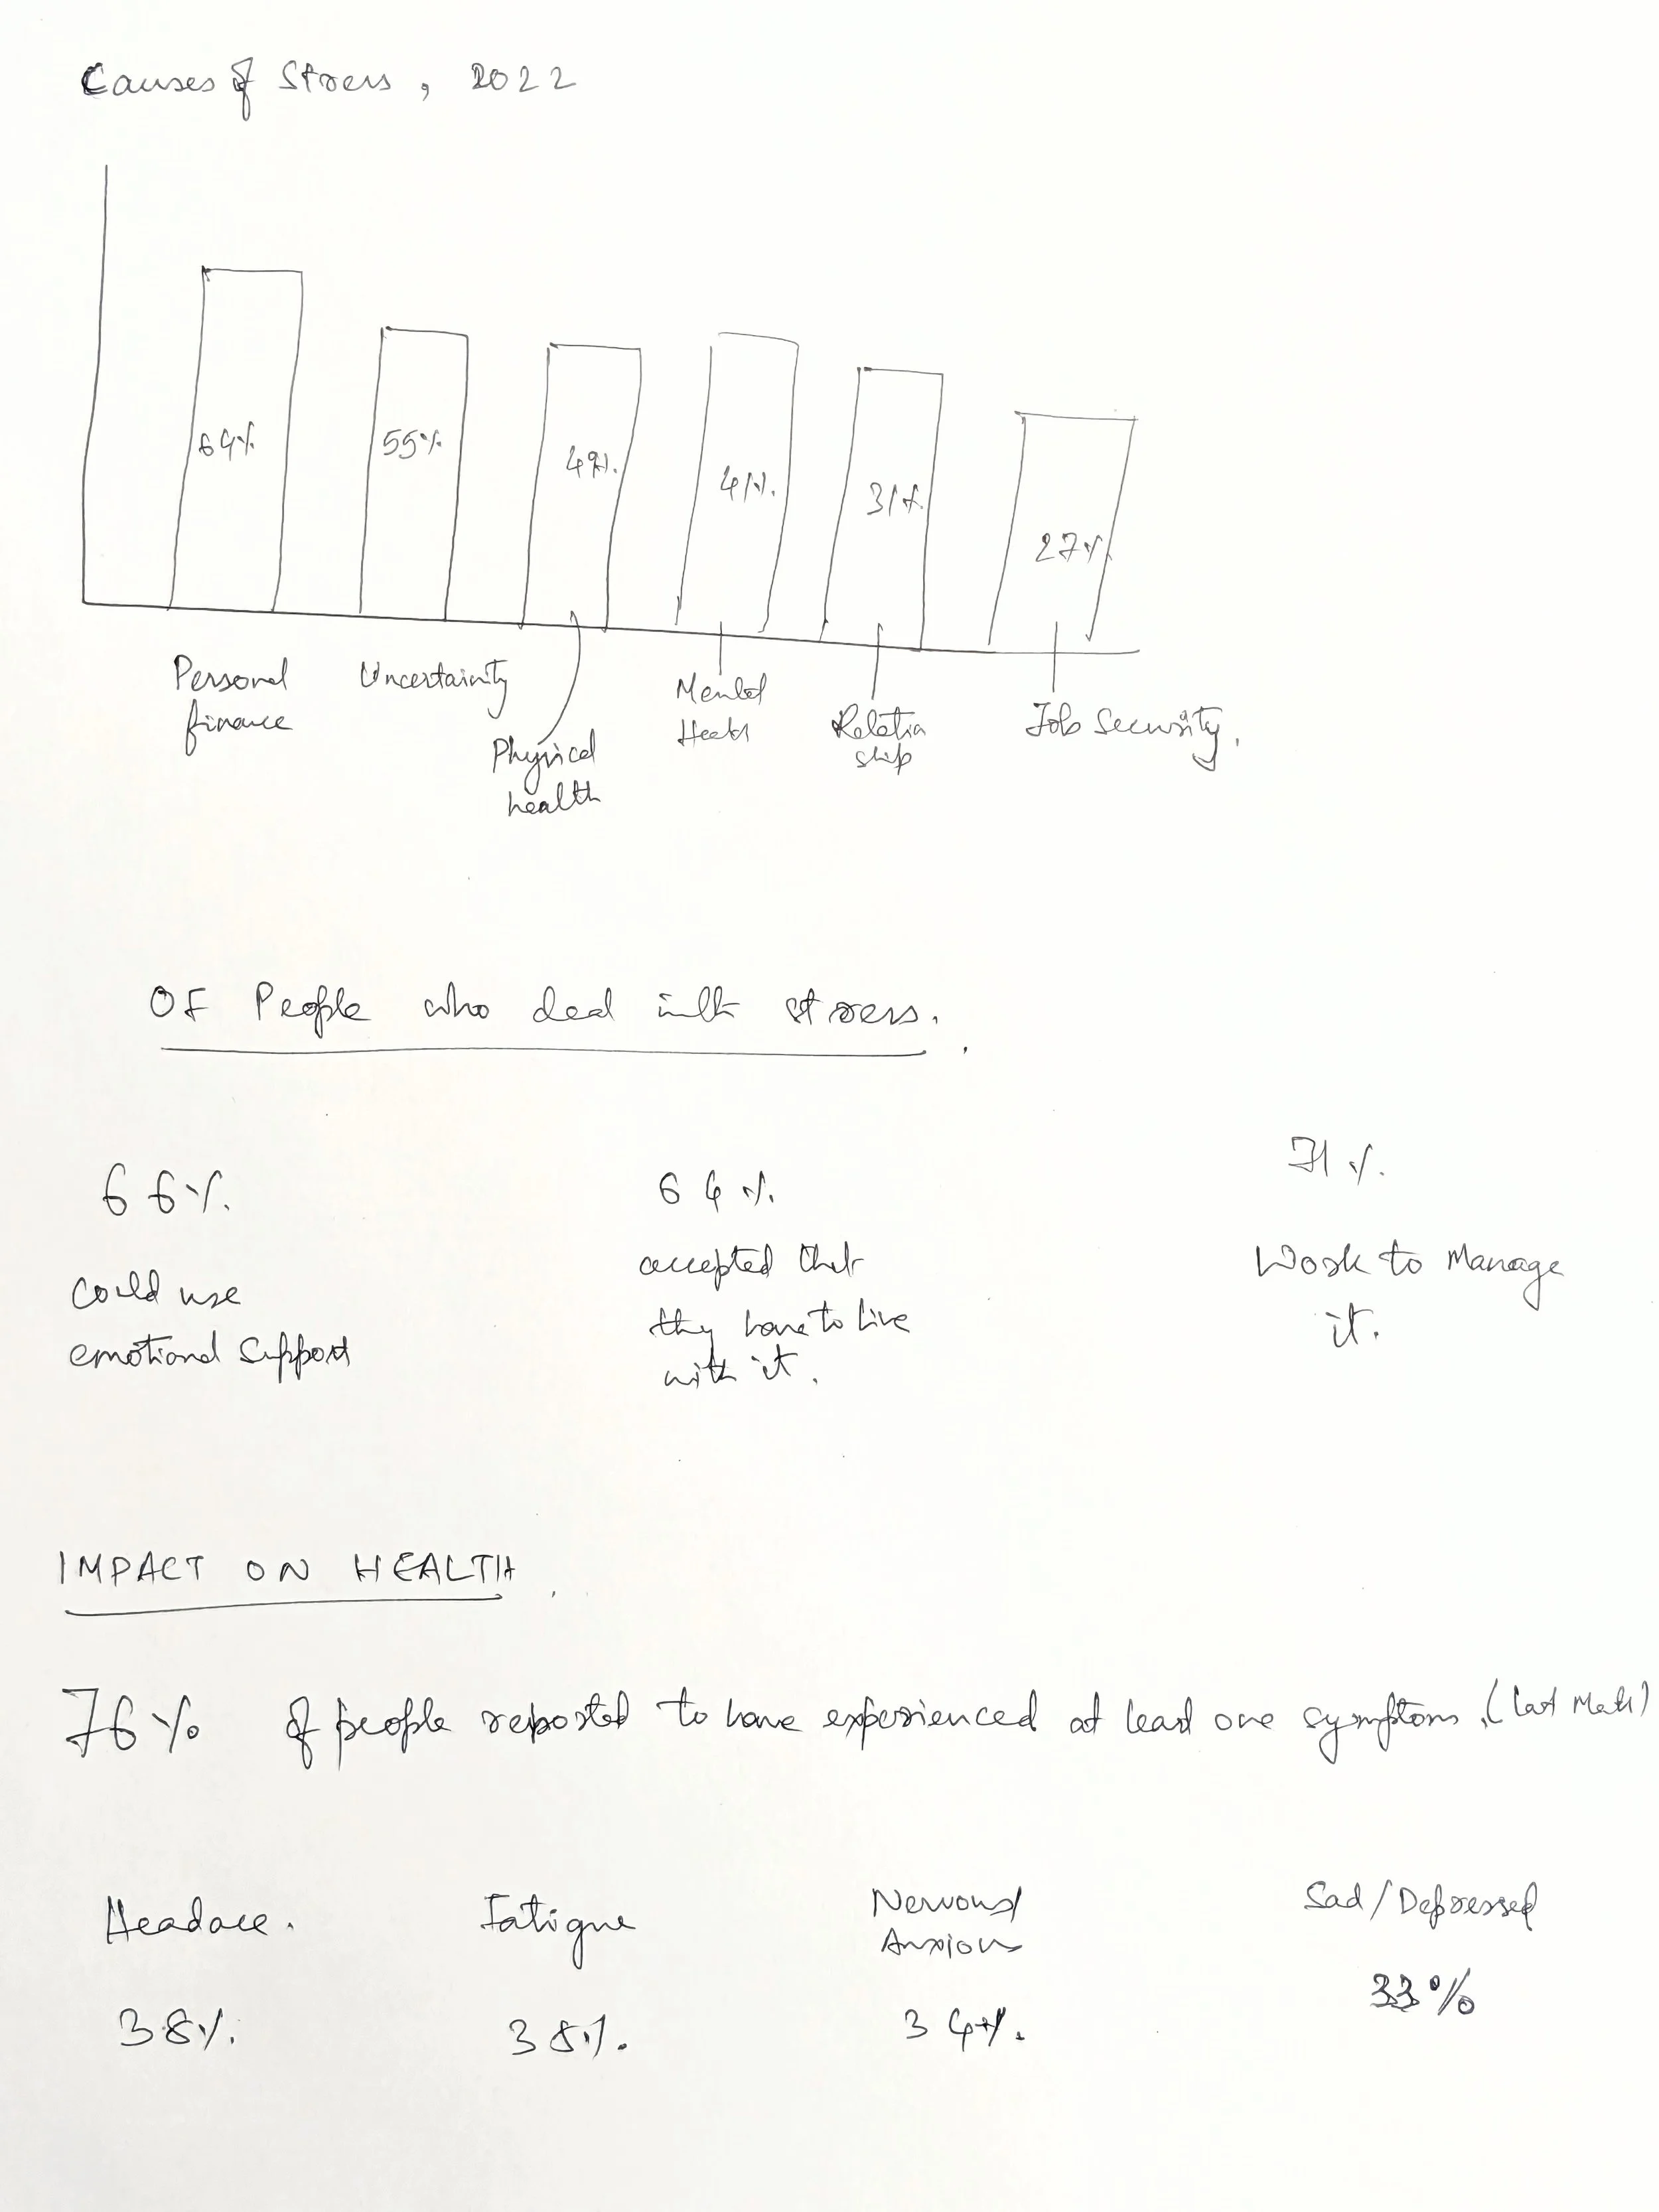
Conflict However, this leads to stress. Half of the people in the US are dealing with stress and their stress is caused due to reasons that are mostly basic.
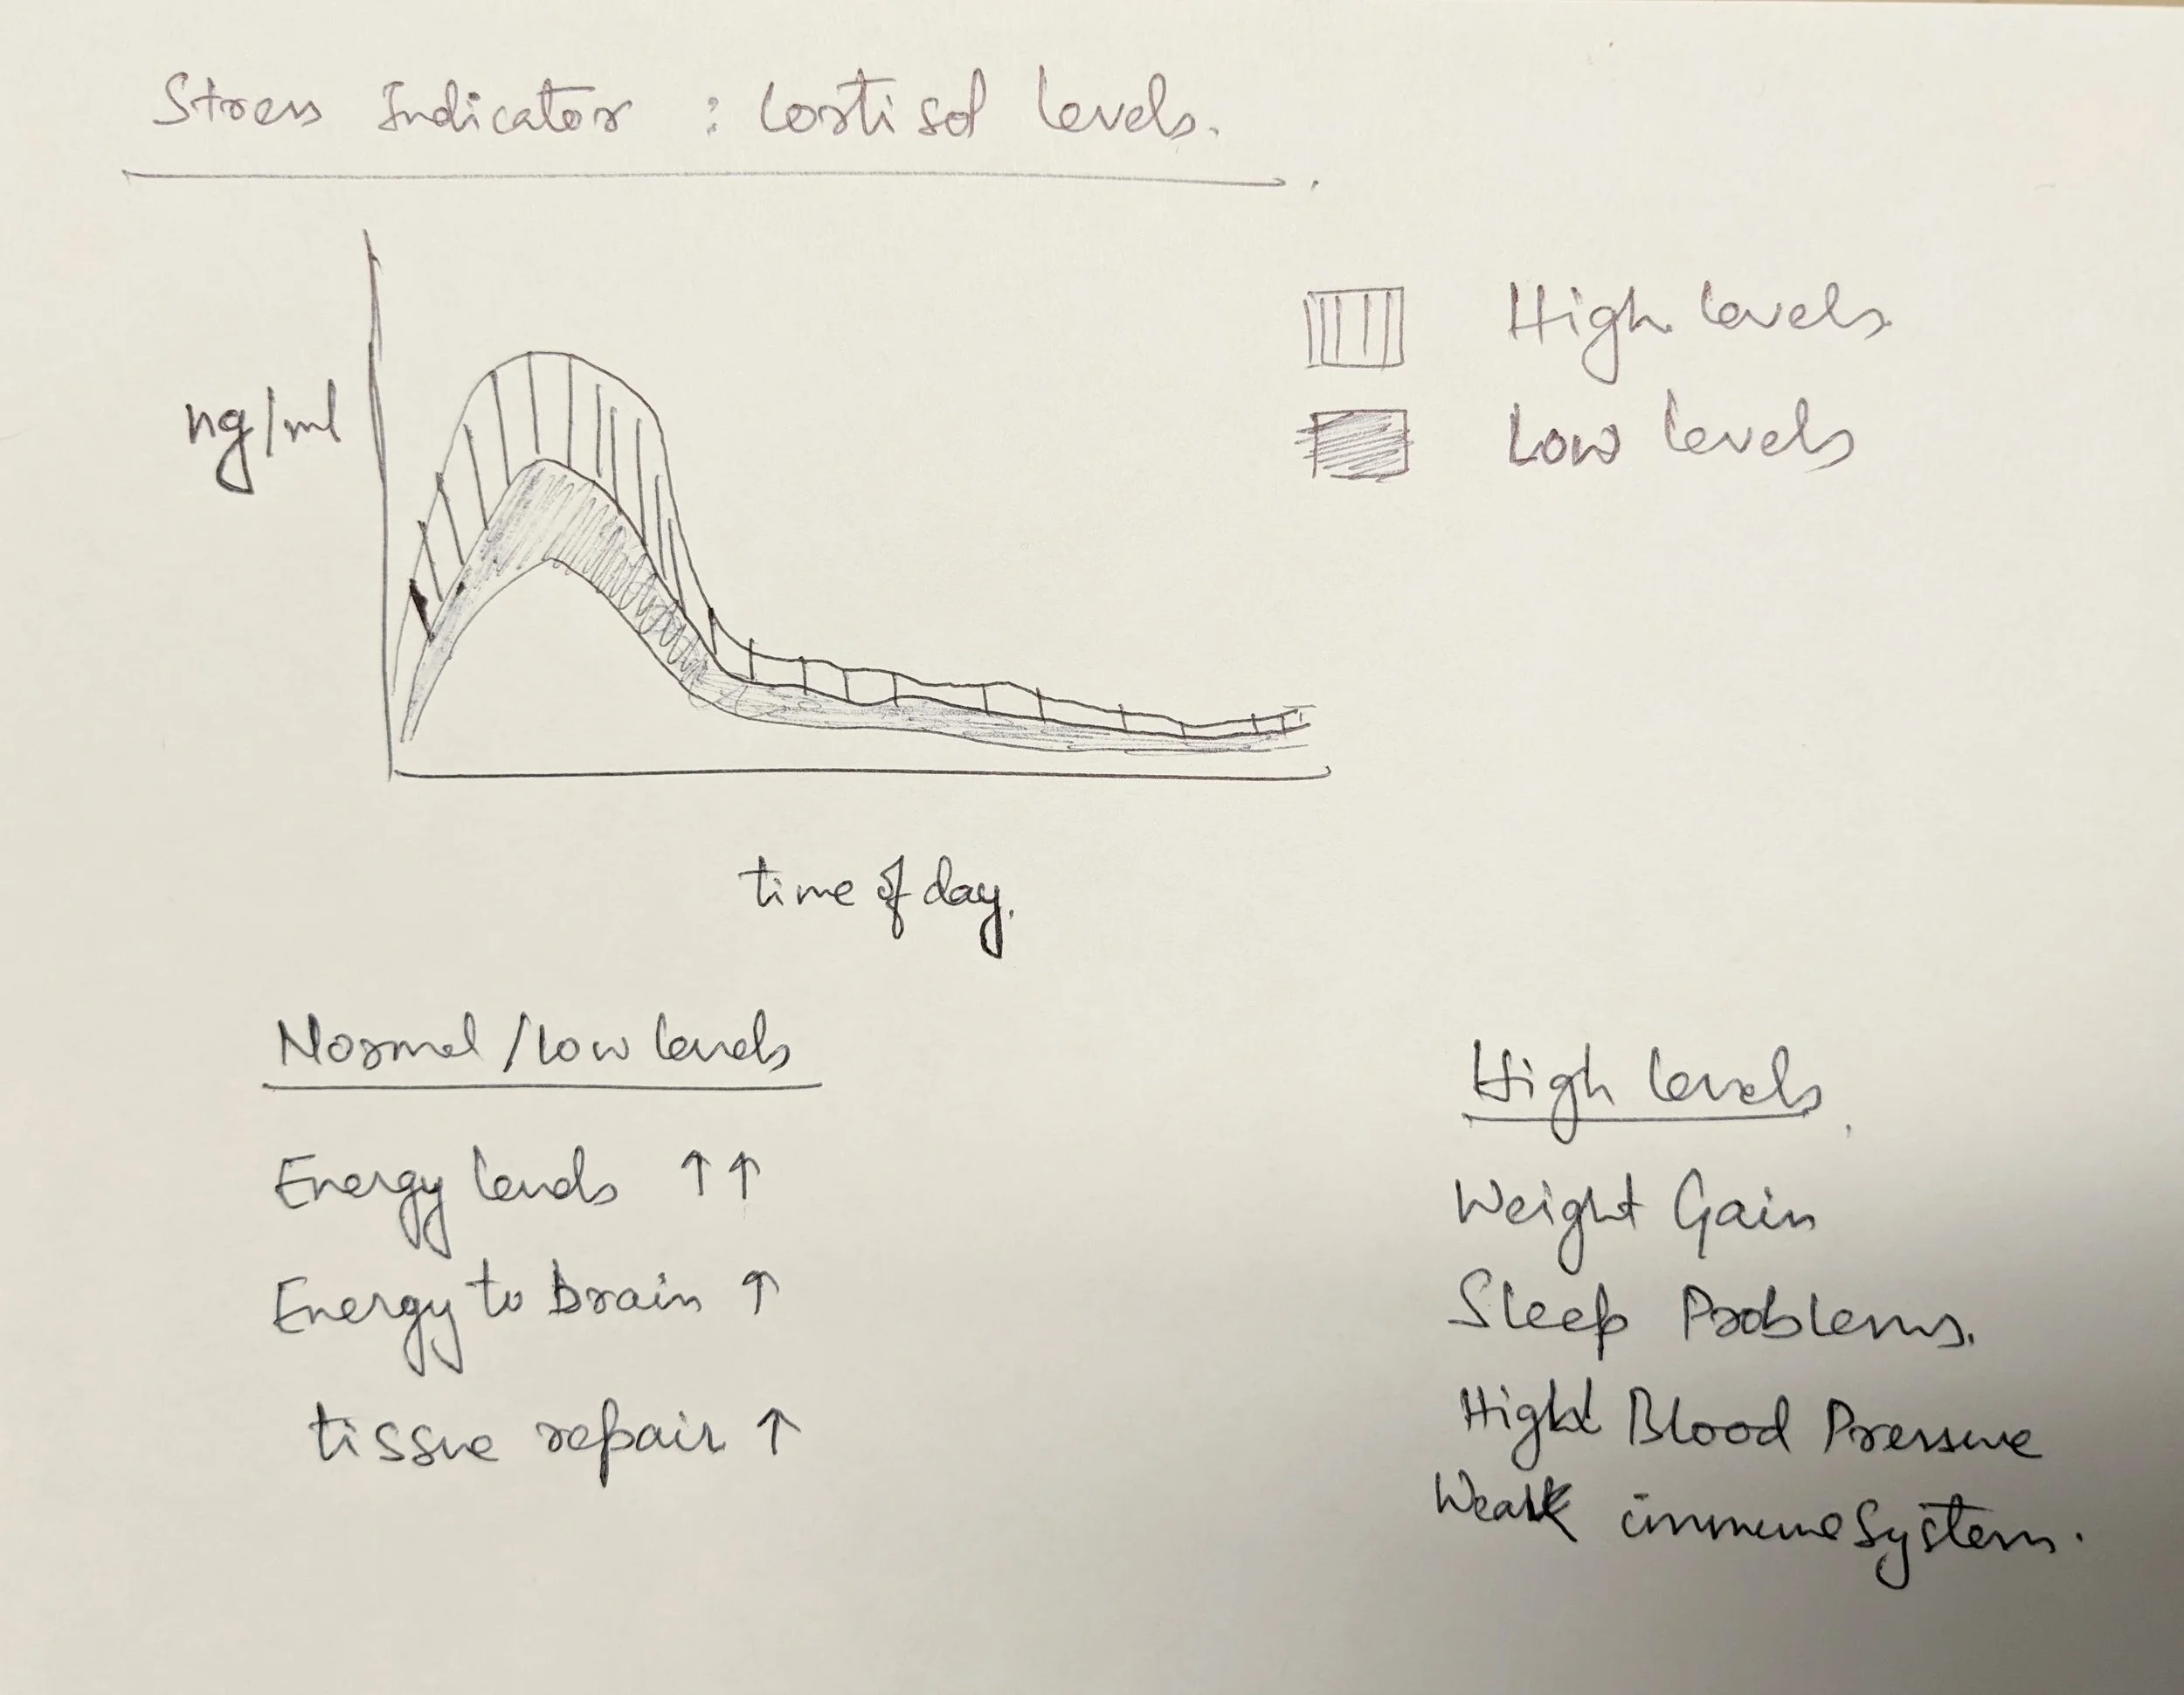
Resolution Knowing how the situation is and some ways to cope up preemptively can help one prepare for it.

This would then be followed by Call to Action for soon to graduate students.
Ways to prepare for this impending stress
How to manage stress
Helplines, and Support Services
Data Sources
For the most part, I will be using publicly available datasets for this project. The two main sources for my data visualizations would be:
Stress in America, October 2022 - This bi-annual report is a quantitative survey of 3192 participants conducted by the marketing research firm The Harris Poll. I would be using data from multiple tables across the report.
IPSOS - French market research and consulting group IPSOS conducts a global mental health survey every year on world mental health day (Oct, 10t). In 2022, the survey was conducted among 23,000 adults across 34 nations.
Apart from these, I would also be referring to some articles for additional context.
UCLA Heath on Cortisol, Health Line on Stress, American Psychiatry Association on American Stress, Stress Org., CMU Post-Grad Outcome, and Harvard Business Review.
Methods & medium
I will be mostly using the tools that have been covered in class for majority of the work. Further, I would be using Shorthand for my final presentation. A detailed description can be found below:
Shorthand for overall data story platform
Figma and Flourish for creating charts and graphs
Figma, Canva and Photopea for photo editing
Unsplash and Pexels for photo sources
Freepik, Nounproject, Flaticon, Iconfinder for icon and graphic sources